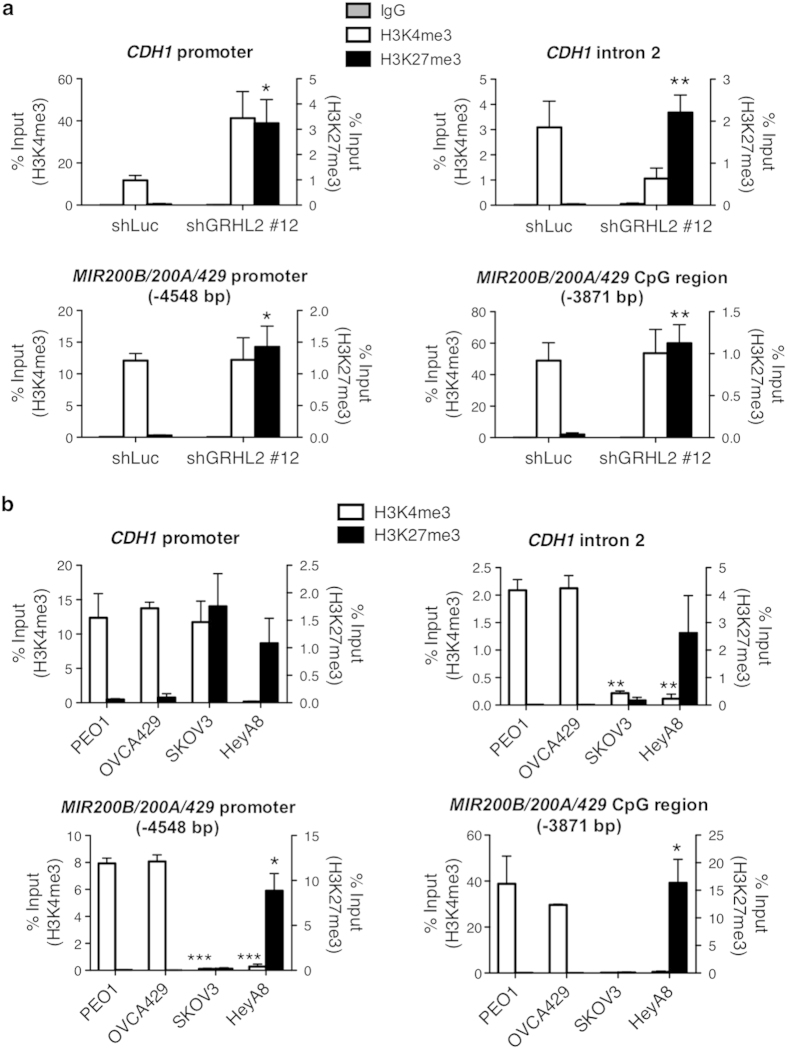
Figure 7. Levels of H3K4me3 and H3K27me3 along the EMT spectrum.
(a) ChIP-qPCR of IgG control (grey, left y-axis), H3K4me3 (white, left y-axis) and H3K27me3 (black, right y-axis) at the promoter region and GRHL2-binding site of CDH1 (intron 2) and MIR200B/200A/429 cluster (CpG region) in OVCA429 shLuc and shGRHL2 #12 cells. Signals of IgG control and ChIP samples were normalized to input DNA and are presented as % input with SEM from two independent experiments. Unpaired t-tests comparing shGRHL2 #12 with respect to shLuc; *p < 0.05; **p < 0.01. (b) ChIP-qPCR results showing the levels of H3K4me3 (white, left y-axis) and H3K27me3 (black, right y-axis) at the promoter region and GRHL2-binding site of CDH1 (intron 2) and MIR200B/200A/429 cluster (CpG region) in PEO1, OVCA429, SKOV3 and HeyA8. Signals of IgG control and ChIP samples were normalized to input DNA and presented as % input with SEM from two independent experiments. Unpaired t-tests were used to compare mesenchymal-like cell lines (SKOV3 and HeyA8) with respect to epithelial-like cell lines (PEO1 and OVCA429); *p < 0.05; **p < 0.01; ***p < 0.001.

