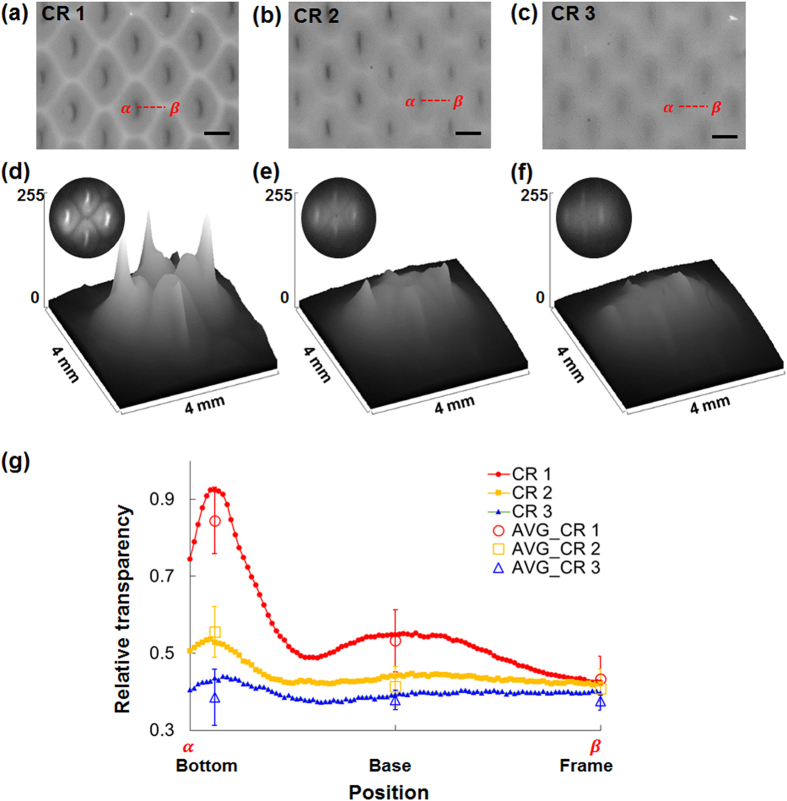
Figure 6.
(a–c) Optical images of the membranes fabricated with CR 1–3 pre-gel solutions. (d–f) Surface plots of light intensity transmitted through the SIMs. (g) Variations in relative transparency of the SIMs across the dotted lines (α–β) in (a–c). Hollow points: average relative transparency at each part of the SIM. Scale bar: 1 mm.

