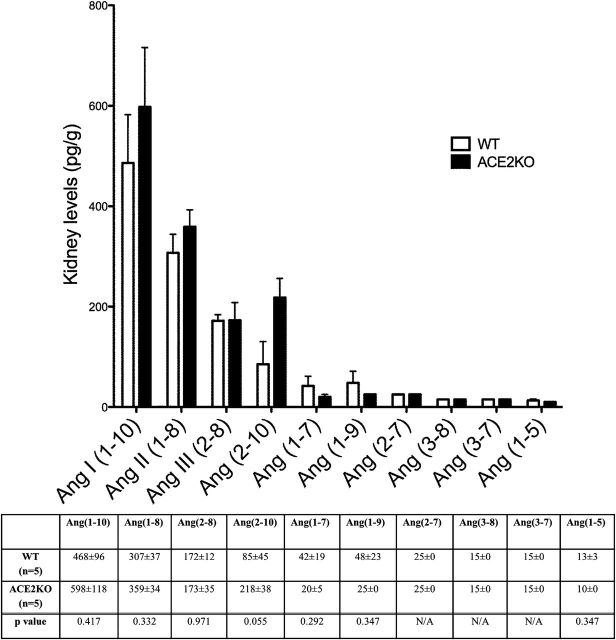
Figure 4.
Kidney Ang peptides levels in WT (□, n = 5) and ACE2KO (■, n = 5) mice represented in order of decreasing concentration (pg/g). The bars and the values in the accompanying table below represent mean ± SE of each angiotensin peptide concentration in WT and ACE2KO mice. P values are from unpaired, two-tailed t-test. When concentrations were below the lower level of quantification (LLOQ), values were given as 0.5 × LLOQ.

