
Fig. 2.
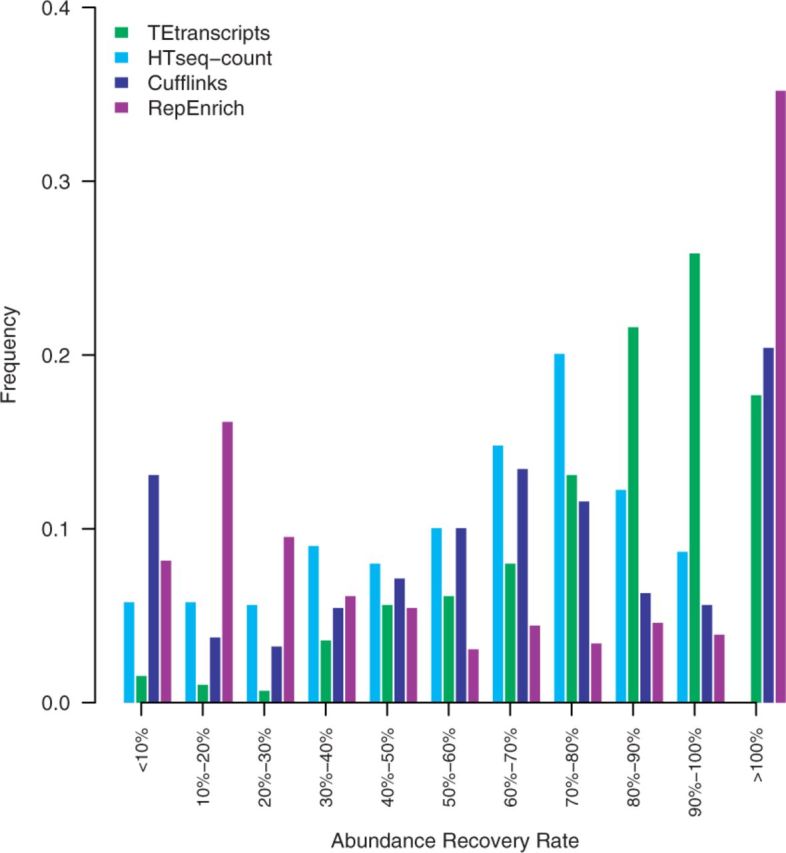
Comparison of TE abundance recovery. Displayed are the distributions of the rate of measured abundances versus true abundances by each method. HTSeq-count abundance recovery rates shown in light blue, Cufflinks recovery rates shown in blue, TEtranscripts with multi mode recovery rates shown in green, and RepEnrich recovery rates shown in purple