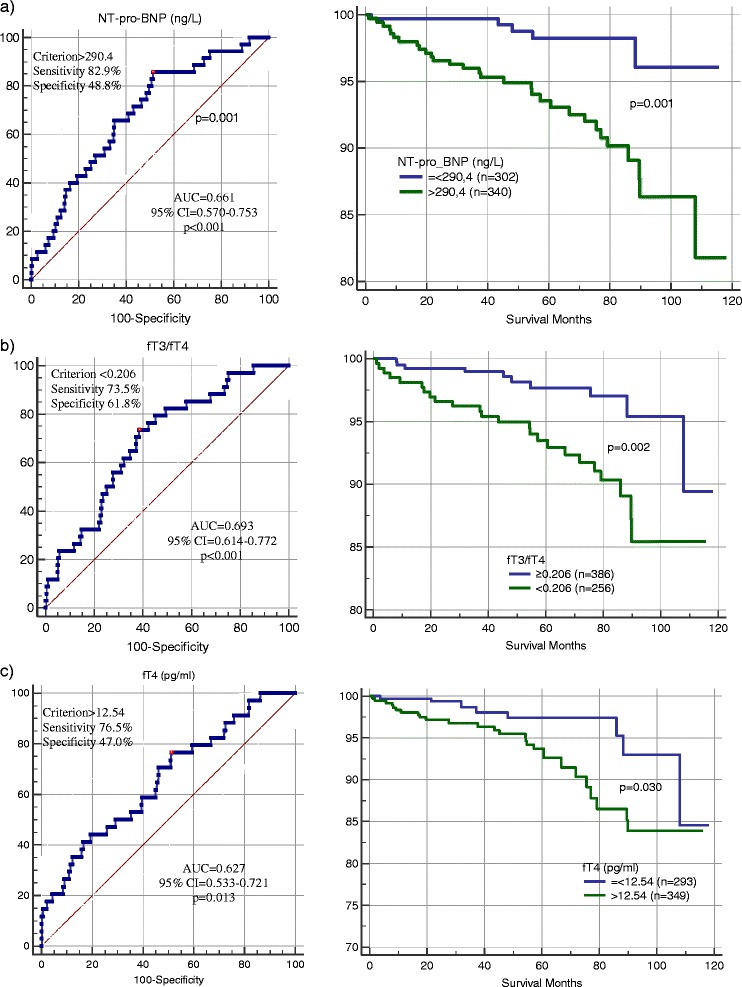
Fig. 2.

Receiver operating characteristics curves and Kaplan-Meier survival plots for a NT-pro-BNP, b fT3/fT4 ratio, and c fT4 values for predicting all-cause mortality during follow-up. Results are the area under the curve (AUC) and associated 95 % confidence interval (CI). The best cut-off values are labeled. A log-rank test was used to compare survival curves. NT-pro-BNP – N-terminal pro-B-Type natriuretic peptide, fT3/fT4 – Free Triiodothyronine/Free Thyroxine ratio, fT4 – Free Thyroxine
