
Fig. 2.
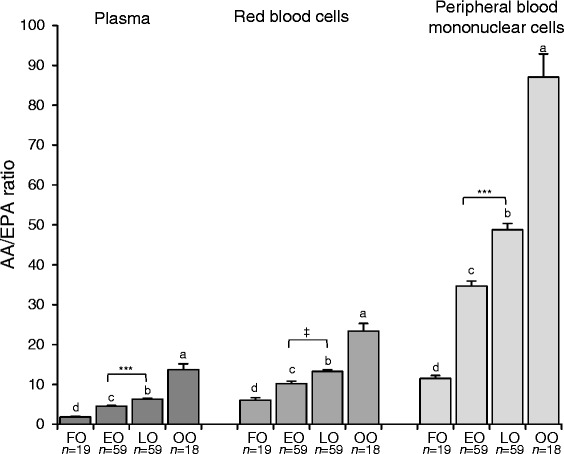
Final AA/EPA ratio in plasma, RBC, and PBMC in subjects following 8 weeks of fish oil, echium oil, linseed oil mixture, or olive oil. Values are means ± SEM. P values were analyzed using the generalized linear mixed model ANCOVA with sex, age, BMI, and baseline value as covariates. abcWithin one blood fraction, means with different superscript letters are significantly different between treatment groups (P ≤ 0.05). ***Means are significantly different between EO and LO treatment (P < 0.001; ‡ P 0.05 < 0.10). AA, arachidonic acid; EO, echium oil; FO, fish oil; LO, linseed oil; OO, olive oil