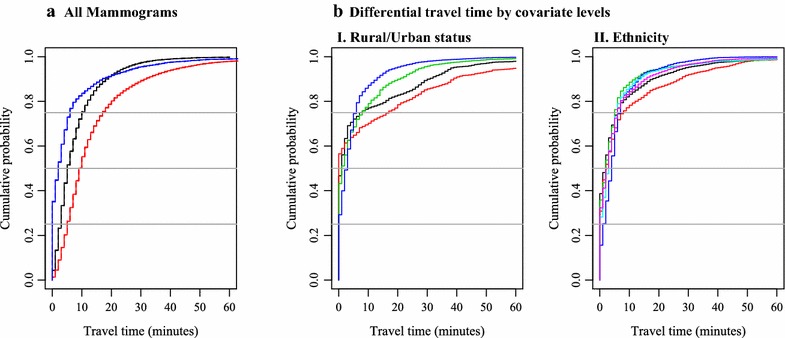
Fig. 1.

a Cumulative distribution functions of actual, closest, and differential drive time. b Cumulative distribution functions of differential drive times by covariates. I Rural/urban status. II Ethnicity. a
 Closest.
  Actual.
  Differential. bI
 Large rural town.
  Small town/isolated rural.
  Sub-urban.
  Urban core. bII
 White, non-Hispanic.
  Black, non-Hispanic.
  Hispanic.
  Asian.
  Native American.
  Other
Other
