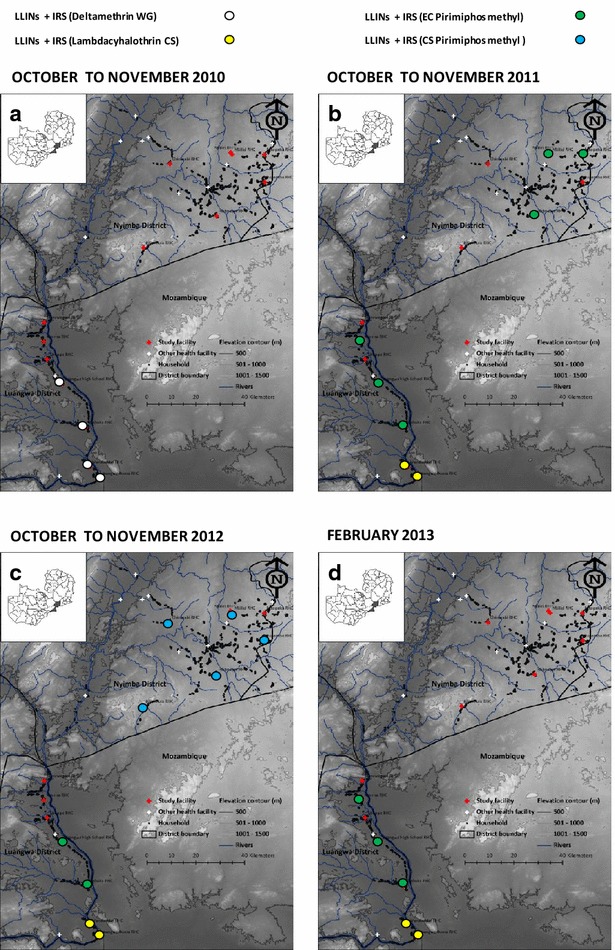
Fig. 1.

Map indicating location of health facilities and associated catchment populations enrolled in the study, with allocation of IRS treatments per cluster and year [a LLINs + IRS (deltamethrin WG); b LLINs + IRS (EC pirimiphos methyl or lambdacyhalothrin CS); c LLINs + IRS (EC pirimiphos methyl or CS pirimiphos methyl or lambdacyhalothrin CS); and d LLINs + IRS (EC pirimiphos methyl or lambdacyhalothrin CS)]
