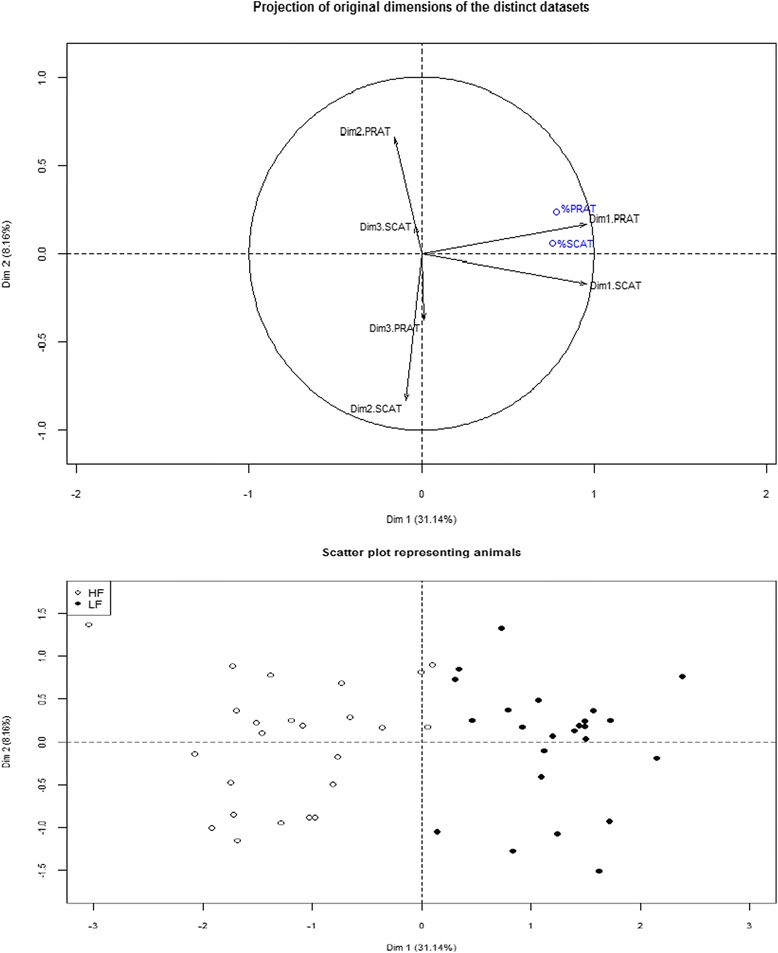
Fig 2.

Multi-way datasets analysis: consensus in microarray data relative to dietary effect across two adipose tissues. The first two synthetic variables obtained for the perirenal (Dim_1_PRAT) and subcutaneous adipose tissue (Dim_1_SCAT) transcriptomes were projected in the correlation circle of the multiple factor analysis (MFA), an integrated statistical method used to reveal communalities across separate datasets. Large similarities across adipose tissues can be deduced from molecular variables contributing to the first dimension (Dim1) of MFA (Fig. 1a). Relative weights of perirenal fat (%PRAT) and subcutaneous fat (%SCAT) were superimposed on the plot, showing strong correlation between the molecular probes contributing to Dim1 and adiposity variations. Pigs were represented on the scatter MFA plot (Fig. 1b) and colored following the diet they received (HF: high-fat high-fiber; LF: low-fat high-starch). This shows a well-defined partition of pigs between diets along Dim1
