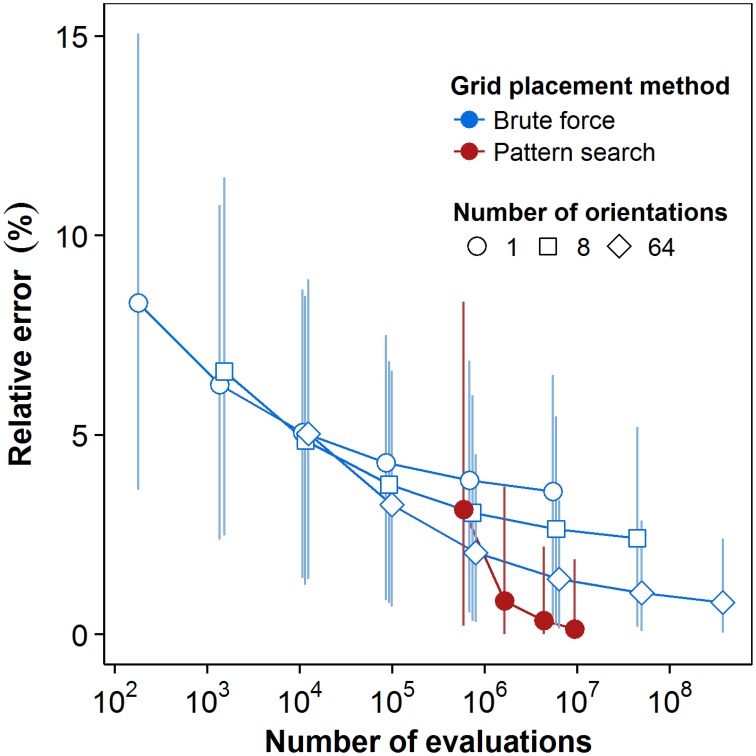
Figure 5.
Convergence plot for the brute force and pattern search methods. Computational cost is quantified as the number of box-counts executed. Box-counts were pooled over all grid sizes and over all plants to reflect the total cost for the dataset. Error estimates reflect the lowest box-counts achievable for a given number of orientations and translations. Point markers represent the mean estimated relative error levels over all (n = 36) plants. Error bars indicate 95% confidence intervals, see text for details.

