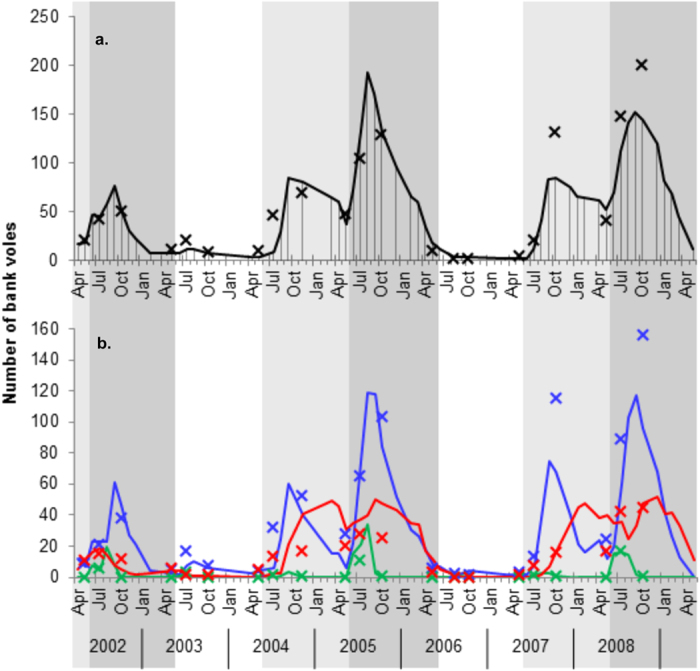
Figure 1.

The number of bank voles on the core (lines) and satellite grids (crosses), (a) in total and (b) according to PUUV infection status. Values for the 14 satellite grids are pooled. Shaded areas indicate phases (Jun 1st to May 31st) of increasing (light grey), peak (dark grey) and low (white) vole density. In a, vertical lines indicate trapping sessions on the core grid. In b, colours indicate infection status: susceptible for PUUV infection (blue), infected with PUUV (red), and MatAb+ (green).
