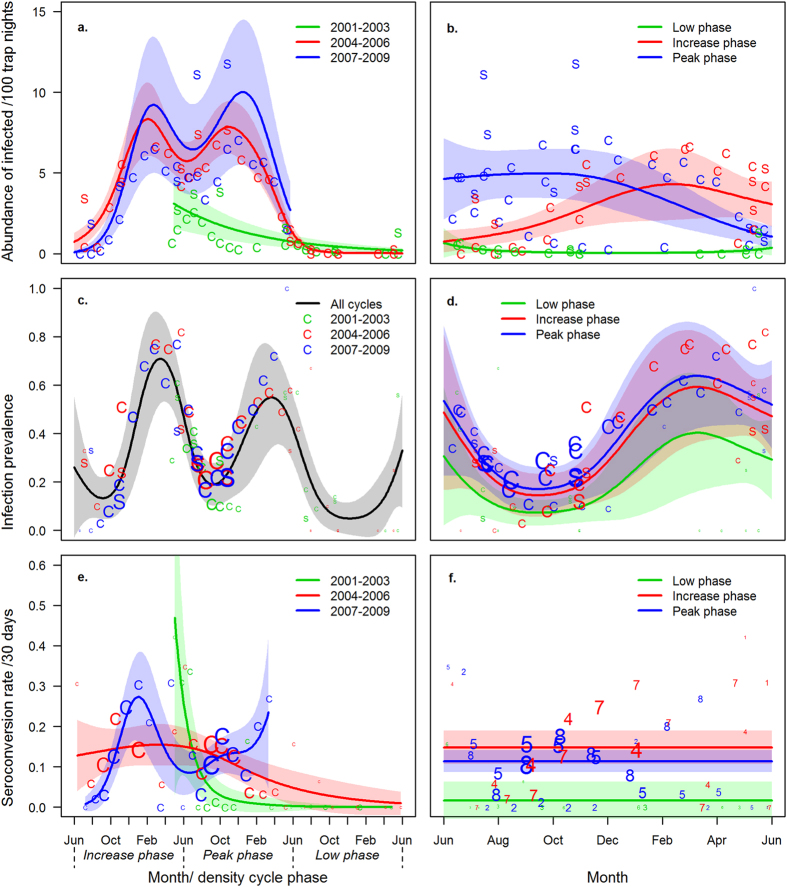
Figure 2.
Variation in the (a,b) abundance of PUUV-infected bank voles/100 trap nights, (c,d) PUUV infection prevalence, and (e,f) seroconversion rate within the time frame of (a,c,e) a vole density cycle and (b,d,f) a year. Lines represent predicted values for the core grid from the best-supported models ((a) cycle ID + s[cycle month by cycle ID]; (b) cycle phase + s[month by cycle phase]; (c) s[cycle month]; (d) cycle phase + s[month]; (e) cycle ID + s[cycle month by cycle ID]; (f) cycle phase; s[…] denote GAM smooth terms). Shaded areas indicate the 95% confidence intervals of parameter estimates. “C” and “S” in a−e denote observed data in core and pooled satellite grids, respectively. Numbers 1−8 in f denote biological years 2001−2008. The character sizes indicate the number of animals (c,d) and total days of exposure (e,f). Green, red, and blue colours indicate different cycles in (a,c,e) and different cycle phases in (b,d,f).

