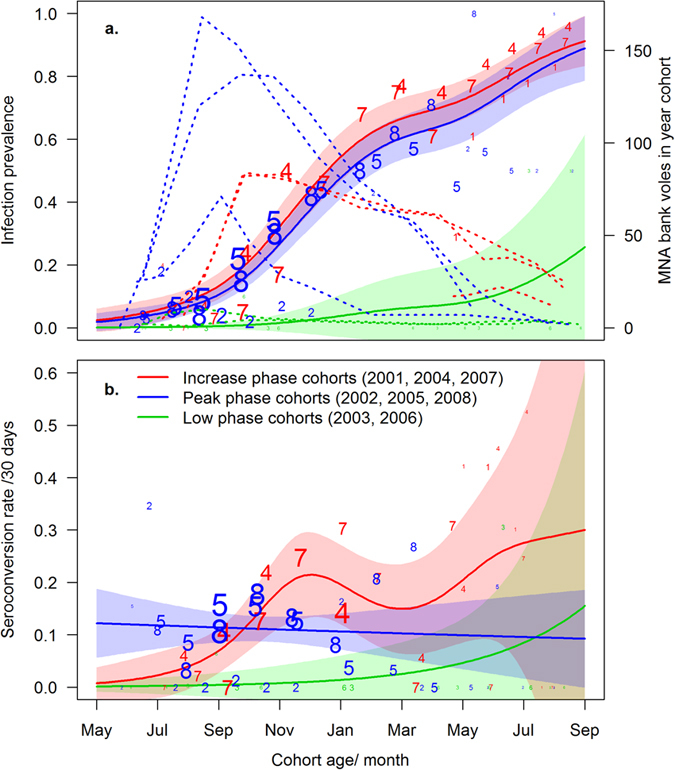
Figure 3.

The (a) prevalence of PUUV infection and (a) seroconversion rate during the lifespan of a yearly bank vole cohort in relation to density cycle phase at birth. Solid lines represent predicted values from the best-supported models ((a) cycle phase + s[cohort age]; (b) cycle phase + s[cohort age by cycle phase]; s[…] denote GAM smooth terms). Shaded areas indicate the 95% confidence intervals of parameter estimates. Dashed lines in a indicate the total number of individuals in yearly cohorts, and colours denote the cycle phase at the summer of birth. Numbers 1−8 denote yearly cohorts 2001 to 2008, their size indicating the total (a) and the number of susceptible (b) animals.
