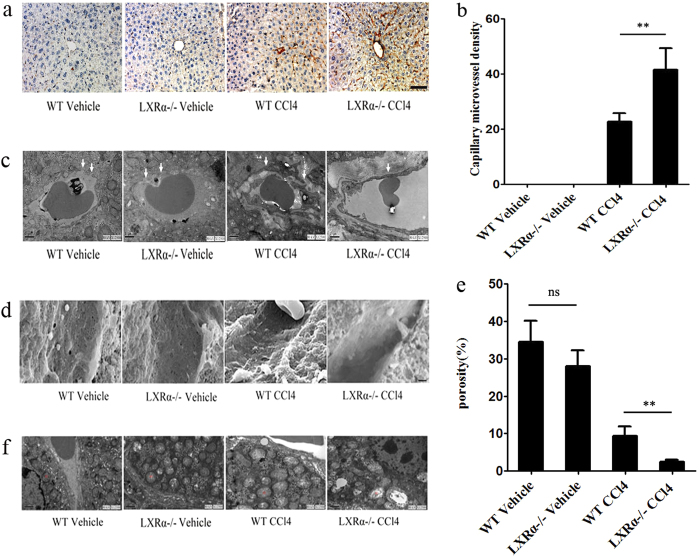
Figure 3. Exacerbation of LSECs capillarization in LXRα KO mice induced by CCl4 chronic administration.
(a) Immunohistochemical staining for CD34 in livers. Scale bar, 50 μm. (b) Statistical analysis of capillary MVD in livers. Data are presented as mean ± SD (**p < 0.01, n = 4, Student’s t-test). (c) TEM and (d) SEM of hepatic sinusoids from WT and LXRα KO mouse treated with CCl4. White arrows indicate the change of basement membranes in hepatic sinusoids. Scale bar, 1μm. (e) Statistical analysis of porosity. Data are presented as mean ± SD (**p < 0.01, n = 3, Student’s t-test). (f) Ultrastructure of mitochondria (by TEM) in hepatocytes from WT and LXRα KO mouse treated with CCl4. Abbreviations: m, mitochondrion.

