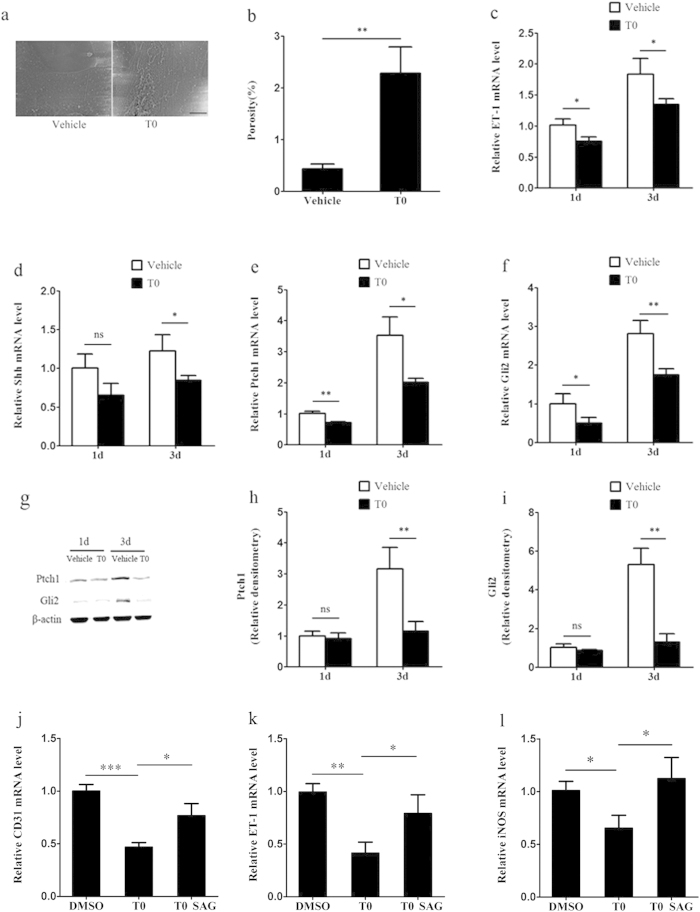
Figure 5. T0 inhibits LSECs capillarization via Hh signalling in vitro.
(a) SEM of LSECs cultured with and without T0 for 2 days showed loss of fenestrae in sieve plates in vitro in the absence of T0 and maintenance of fenestrae with T0. Scale bar, 5μm. (b) Porosity of liver sections was quantified. Data are presented as mean ± SD (**p < 0.01, n = 3, Student’s t-test). (c) Quantitative Real-Time PCR analysis of ET-1 expression changes during culture-induced capillarisation with and without T0. Data are presented as mean±SD (*p < 0.05, n = 3). (d–f) Quantitative Real-Time PCR analysis of the expression change of Shh ligand, the cell surface receptor for Hh ligand Ptch1 and Hh target gene Gli2. Data are presented as mean ± SD (*p < 0.05, **p < 0.01, n = 3, Student’s t-test). (g–i) Western blot and graphic analysis of the expression of Ptch1 and Gli2 in the cultured LSECs with and without T0. The levels of the Ptch1 and BLBP protein are expressed relative to the levels of the β-actin. Data are presented as mean ± SD (**p < 0.01, n = 3, Student’s t-test). Abbreviations:d,day. (j–l) LSECs were treated with T0 for 24 hours and then treated with either DMSO or SAG for 24 hours. Quantitative Real-Time PCR analysis of the gene expression changes of iNOS, ET-1 and CD31. Data are presented as mean ± SD (*p < 0.05, **p < 0.01, ***p < 0.001, n = 3, Student’s t-test).

