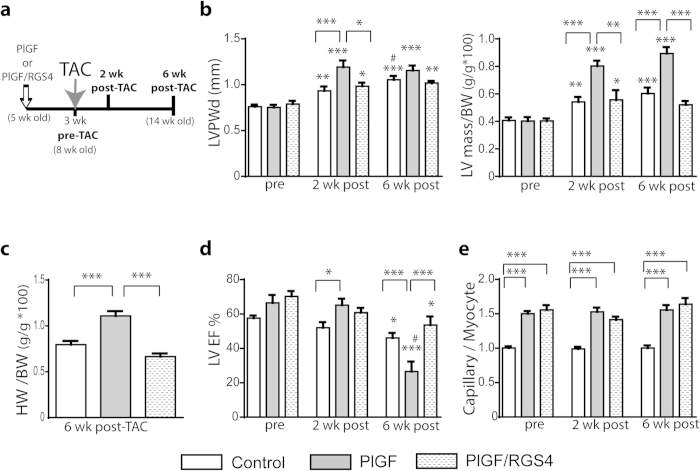
Figure 5. Angiogenesis-induced hypertrophic response augments myocardial hypertrophy during LV pressure overload.
(a) PlGF and PlGF/RGS4 mice were subjected to TAC after 3 weeks of angiogenesis stimulation. All groups were examined at 2 and 6 weeks after TAC. (b) Echo-determined LVPWd thickness and LV mass/BW ratio at 2 and 6 weeks after TAC. Greater myocardial hypertrophy in PlGF mice after TAC, compared with PlGF/RGS4 and control mice. (c) HW/BW ratio 6 weeks after TAC in all groups. (d) Echo-determined LVEF prior and at 2 and 6 weeks after TAC. (e) Capillary/myocyte ratio in all groups prior to TAC and up to 6 weeks after TAC. n = 11 (controls); 6 (PlGF); 5 (PlGF/RGS4). *P < 0.05, **P < 0.01, ***P < 0.001 vs. pre-TAC or as indicated; # P < 0.05 vs. 2 wk post-TAC.

