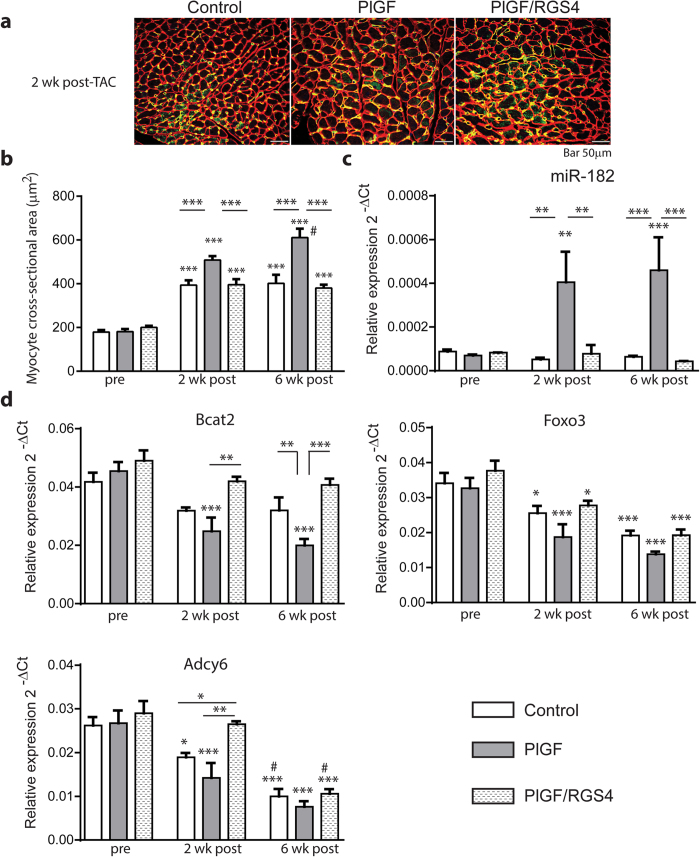
Figure 6. miR-182 is not associated with the hypertrophic response induced by LV pressure overload.
(a) Representative immunostaining with anti CD31 and anti-laminin Abs of LV myocardium sections at 2 weeks post-TAC in PlGF, PlGF/RGS4 and control mice. (b) Increased cardiomyocyte cross-sectional area in LV myocardium sections in all groups after TAC. Greater cardiomyocyte area in PLGF mice. (c) Increased miR-182 expression in PlGF mice, but not in PlGF/RGS4 or control mice. (d) Comparative analysis of Bcat2, Foxo3 and Adcy6 expression prior and during TAC. n = 6 (control pre-TAC); 6 (PlGF pre-TAC); 6 (PlGF/RGS4 pre-TAC); n = 7 (control 2 wk post-TAC); 4 (PlGF 2 wk post-TAC); 4 (PlGF/RGS4 2 wk post-TAC); 6 (control 6 wk post-TAC); 6 (PlGF 6 wk post-TAC); 5 (PlGF/RGS4 6 wk post-TAC). *P < 0.05, **P < 0.01, ***P < 0.001 vs. pre-TAC or as indicated; # P < 0.05 vs. 2 wk post-TAC.

