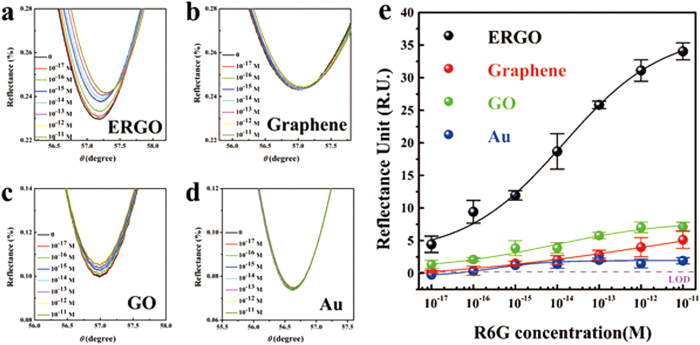
Figure 2. SPR spectra of R6G for a series of concentrations (10−17-10−11 M) adsorbed on ERGO (a), graphene (b), GO (c), and Au film (d).
Relationship between the SPR signal change and the R6G concentration on the ERGO, graphene, GO, and Au film substrates (e). Each point corresponds to the SPR response shift for the particular concentration of R6G molecules.

