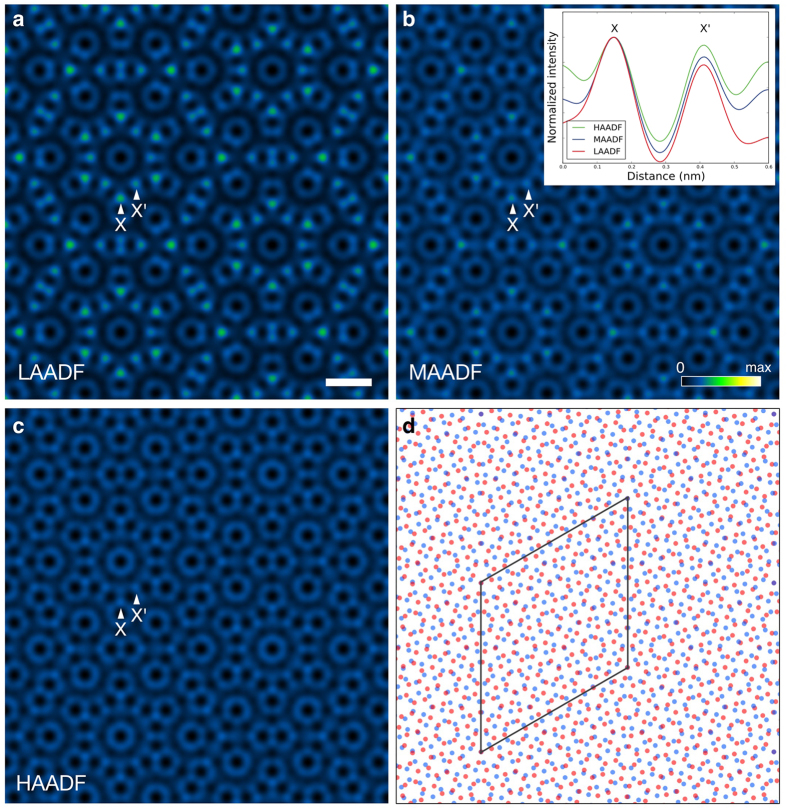
Figure 4. Detector angle dependence of simulated ADF STEM images with ∑79 twisted bilayer graphene.
The simulated ADF STEM images of ∑(3,7) = 79 with AB-stacking TBG, where the detector spans (a) 32-240 mrad, (b) 45–240 mrad and (c) 64-240 mrad, respectively. Intensity ranges are 0 to (a) 1% (b) 0.5% and (c) 0.25% of the incident electrons. The notations of X and X’ correspond to the locations of small and large hexagonal vertices, respectively. The inset of (b) shows the intensity profile along X-X’ direction, where the intensities are normalized to the maximum at X. (d) The structure model used for the image simulations, where red and blue atoms correspond to the top and bottom layers respectively, and the parallelogram is the primitive unit cell. The scale bar in (a) is 0.5 nm.

