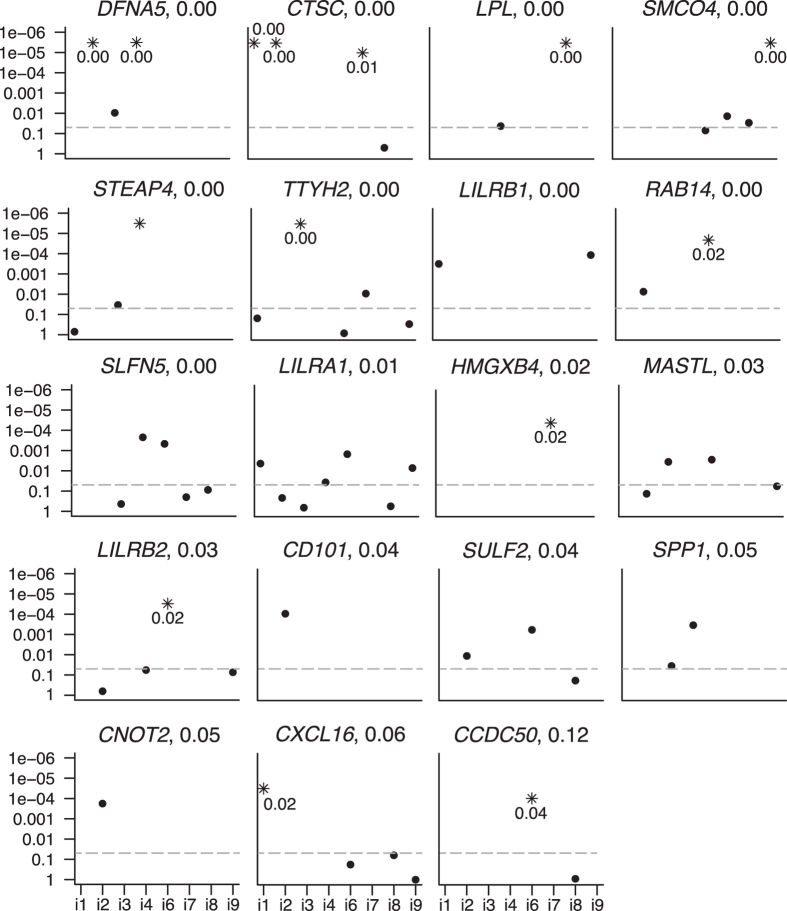
Figure 3. Genes with condition-dependent ASE.
GeneiASE p-values for each individual (i1 – i9) for all genes that exhibited significant cd-ASE in at least one individual or in the meta-analysis. Each figure panel corresponds to one gene, with the gene name stated above each panel. Genes are ranked from left to right, top to bottom, according to their multiple testing adjusted p-value from the meta-analysis. This p-value is indicated next to the gene name. Dashed grey line indicates nominal GeneiASE p-value 0.05. A missing dot means that the gene did not contain at least two SNVs in that individual. (*) indicates significant icd-ASE (multiple testing adjusted p-vale < 0.05) in that individual. Y-axis, nominal GeneiASE p-value.

