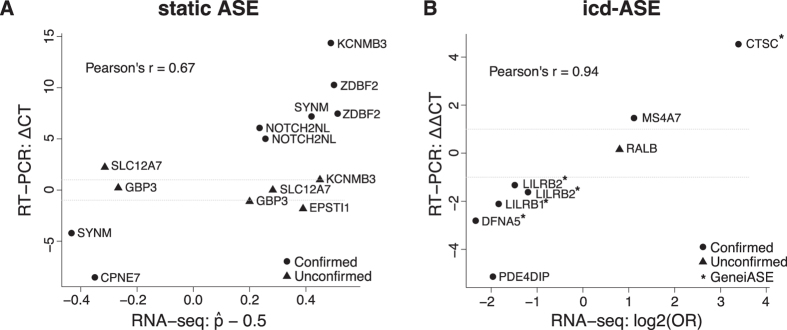
Figure 4. Correlation of ASE effect sizes from RNA-seq and real-time quantitative RT-PCR.
(A) Static ASE. Y-axis, RT-PCR ASE effect size: ΔCT = ASERT-PCR(ref,alt) = CT(ref) - CT(alt), i.e., difference in mean cycle threshold between the two alleles. X-axis, RNA-seq ASE effect size (Eq. 1, but without taking the absolute value). (B) icd-ASE. Y-axis, RT-PCR icd-ASE effect size: ΔΔCT = ΔASERT-PCR(T-U) = ASERT-PCR(T) – ASERT-PCR(U). X-axis, RNA-seq ASE effect size ΔASERNA-seq (Eq. 2). Circles, confirmed by RT-PCR. Triangles, not confirmed. For icd-ASE: (*) indicates the five variants from the four genes detected as significant by GeneiASE.

