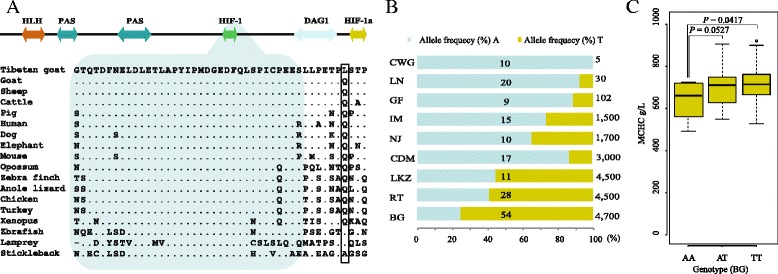
Fig. 3.

EPAS1 mutation in the coding regions. a EPAS1 protein sequence analysis. The protein coordinate is based on NCBI RefSeq XP_005686651.1. The upper panel shows the Pfam domains of the protein. The double arrows represent domains of goat EPAS1. The orthologous protein sequences from 17 vertebrates are aligned with the mutant residues shown in the box. Sheep, ENSOARP00000006140; cattle, ENSBTAP00000004836; pig, ENSSSCP00000009011; human, ENSP00000406137; dog, ENSCAFP00000003819; elephant, ENSLAFP00000010336; mouse, ENSMUSP00000024954; opossum, ENSMODP00000001136; zebra finch, ENSTGUP00000004086; anole lizard, ENSACAP00000004025; turkey, ENSGACP00000015093; xenopus, ENSXETP00000031612; zebrafish, ENSDARP00000074832; lamprey, ENSPMAP00000000148; stickleback, ENSGACP00000015093. (HLH) helix-loop-helix domain; (PAS) Per-Arnt-Sim; (HIF) hypoxia-inducible factor; (CTAD) C-terminal transactivation domain; (DAG1) Dystroglycan (Dystrophin-associated glycoprotein 1), the blue shade represent the HIF-1 domain. b Percentages of the reference allele and variant allele in larger population samples that were genotyped with Sanger sequencing technology. The number on the bar represents the sample size. The altitude information is shown at the right side of the bars. c Association analysis between EPAS1 genotypes (mutant allele, T; reference allele, A) and the MCHC in BG population. The ANOVA F-test was performed, and we found a significant association between the genotypes and MCHC
