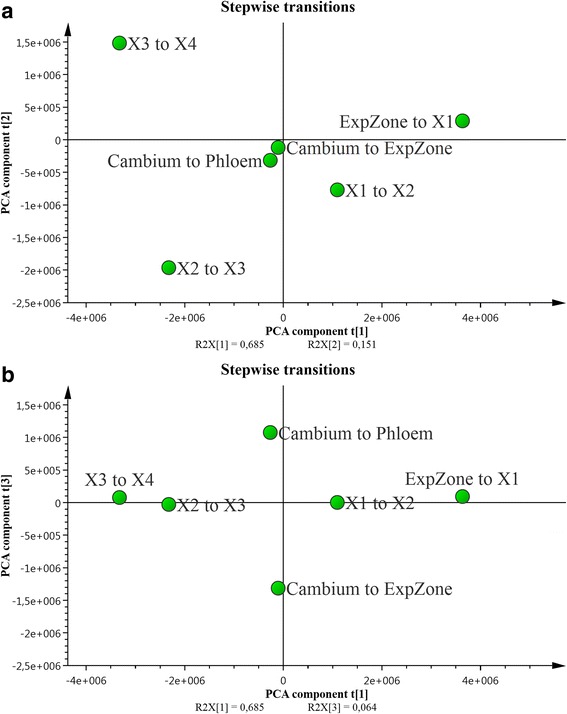
Fig. 4.

Joint genotype effect scores from the stepwise transition PCA models. PCA model overview of the consecutive development transitions in the sampled wood, i.e. Cambium to Phloem transition: Cambium to expansion zone (ExpZone) transition: E/X1, expansion zone (ExpZone) to xylemX1 transition: X1/X2, xylemX1 to X2 transition: X2/X3, xylemX2 to X3 transition: X3/X4, xylemX3 to X4 transition: (a) The t1–t2 PCA score plot. (b) The t1–t3 PCA score plot
