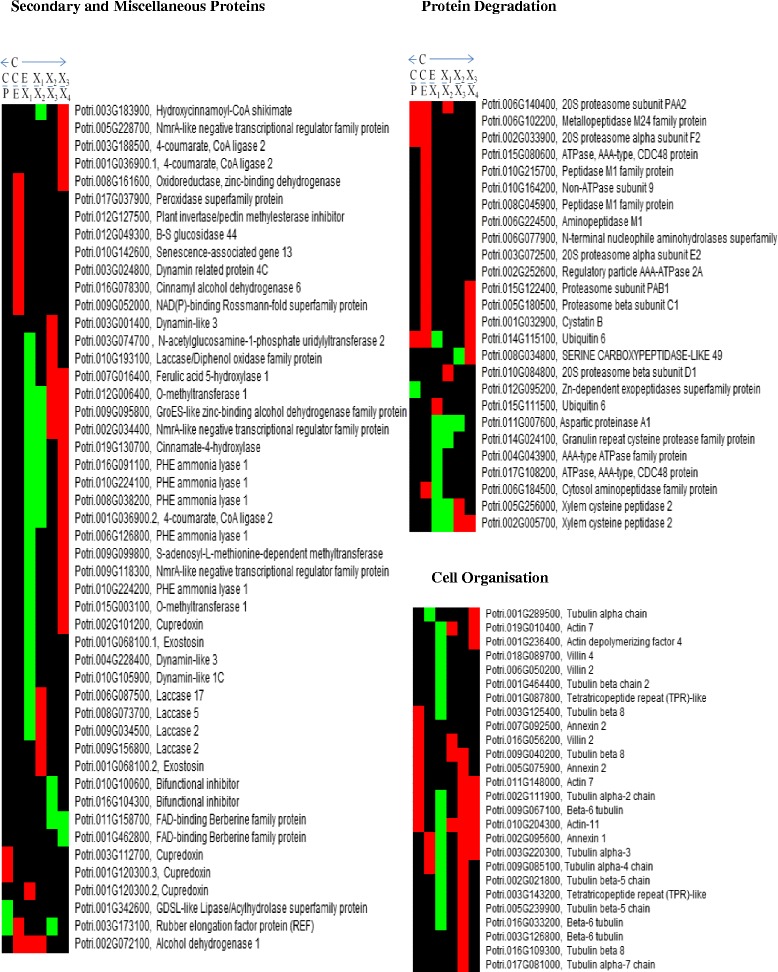
Fig. 6.

Visualization of patterns and trends of the differentially expressed protein families across the series of development zones from cambium outwards to phloem and inwards to xylem. Profiles of protein families encoding or involved in: cell organization, protein degradation and secondary metabolism and miscellaneous proteins. The red, green, and black color-codes show downregulation, upregulation and no change in expression, respectively, in indicated transitions. Symbols illustrated in Fig. 1: Symbols: C/P, cambium-phloem transition: C/E, cambium-expansion transition: E/X1, expansion-xylemX1 transition: X1/X2, xylemX1–X2 transition: X2/X3, xylemX2–X3 transition: X3/X4, xylemX3–X4 transition
