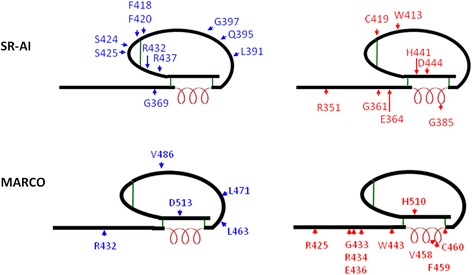
Fig. 4.

Schematic representation shows the SRCR mutations in SR-AI and MARCO. The mutations sites at loop structure are shown in blue and those at α-helix, β-sheet, η-helix and disulfide structure are shown in red. The black line indicates the sequence of SRCR; α-helix is indicated as red spring, and disulfide bonds are shown as green line
