
Fig. 2.
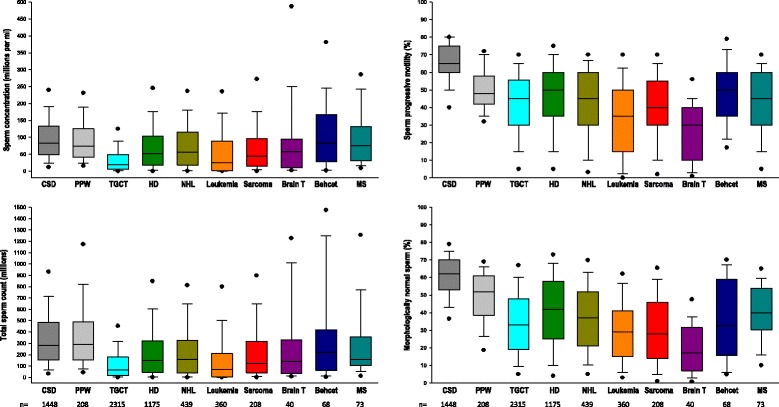
Box plot displaying the 10th, 25th, 50th, 75th, and 90th percentile values and the extreme 5th and 95th percentiles (circles) of sperm concentration, total sperm count, progressive sperm motility and normal sperm morphology according to the various pathological conditions. Distributions in healthy fertile men (CSD and PPW) are presented for comparison (see Table 2 for statistical comparisons)