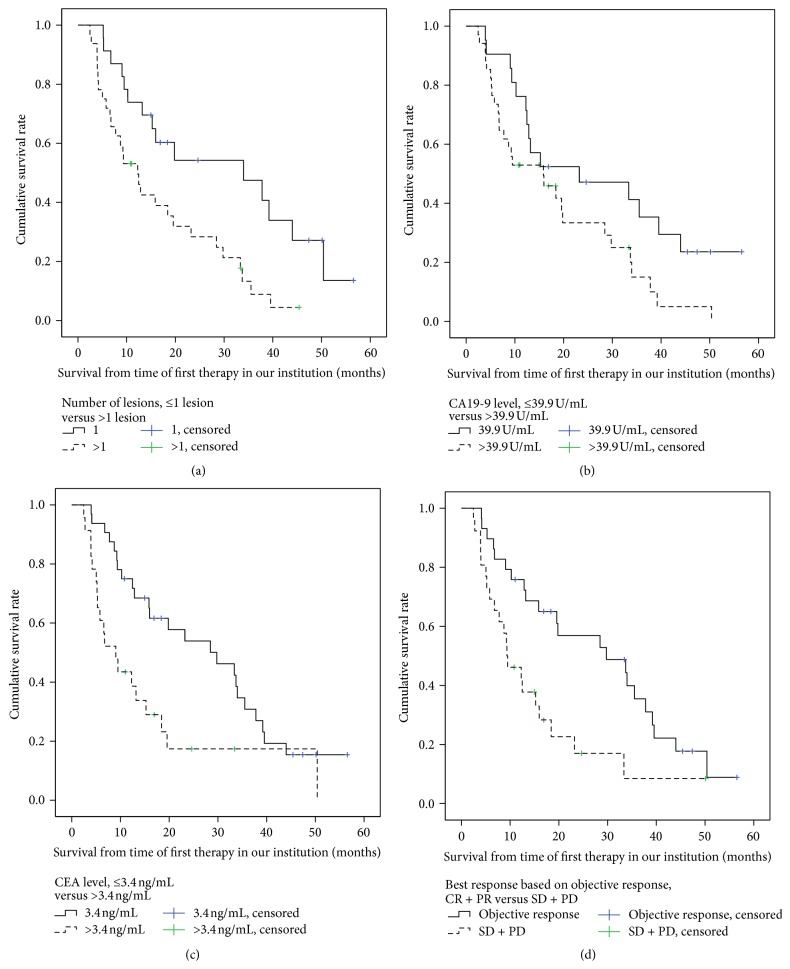
Figure 3.
Overall survival rate in all patients according to influencing factors (derived from Cox model, Table 3). (a) Overall survival rates with regard to number of lesions (≤1 lesion versus >1 lesion), with a median overall survival of 34 and 12.3 months, p = 0.006. (b) Overall survival rates with regard to CA 19-9 level (≤39.9 U/mL versus >39.9 U/mL) with a median overall survival of 23.2 and 15.9 months, p = 0.043. (c) Overall survival rates with regard to CEA level (≤3.4 ng/mL versus >3.4 ng/mL), with a median overall survival of 29.8 and 9.1 months, p = 0.007. (d) Overall survival rates with regard to best response (objective response (CR and PR) versus stable and progressive disease (SD + PD)), with a median overall survival of 29.8 and 9.3 months, p = 0.005.

