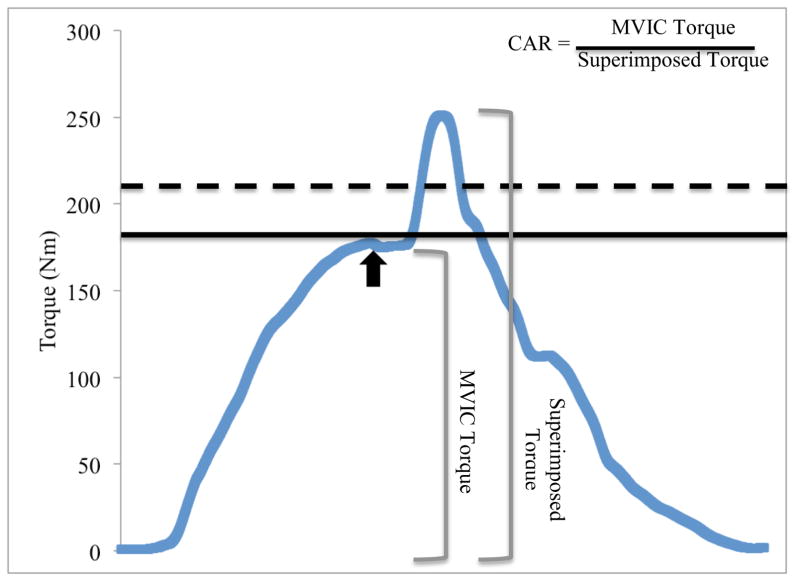
FIGURE 1.
Screenshot from strength and central activation testing. The curved line represents the participant’s real-time torque output. The solid, straight line corresponds to the participant’s peak value from the maximal voluntary isometric contraction (MVIC) trials and also served as a threshold for central activation testing. Real-time torque output must cross this threshold for the electrical stimulus to be delivered. The dotted line represents the participant’s target value, which was set 10% above maximal strength. The black arrow corresponds to delivery of the electrical stimulus. The observed increase in torque following the plateau in MVIC is considered to be elicited by the electrical stimulus. The central activation ratio (CAR) is calculated as the MVIC value divided by the torque elicited when the stimulus is superimposed on the MVIC.

