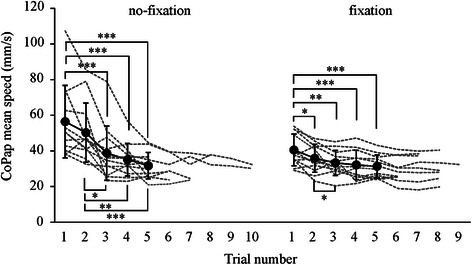
Fig. 3.

Mean speed of CoPap fluctuation during floor oscillations. Filled circles and solid lines indicate the average and standard deviation, respectively, in each trial until the fifth trial. Dashed lines indicate the mean speed of CoPap fluctuation over all trials for each subject. *p < 0.05; **p < 0.01; ***p < 0.001
