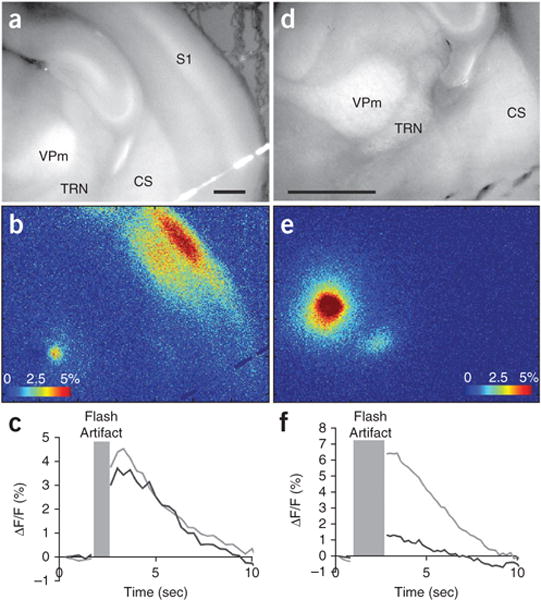
Figure 4.

Examples of synaptic activation following photostimulation. (a–c) Correspond to thalamocortical activation at ×2.5 magnification after a single run of photostimulation in VPm, taken from the same set of experiments as Figure 7c of Llano et al5, but from a different run. (d–f) Correspond to thalamoreticular activation at ×5 magnification after a single run of photostimulation in VPm, taken from the same set of experiments as Figure 11 of Llano et al5, but from a different run from those illustrated in that publication. (a,d) Raw images for anatomical orientation. Scale bars, 1 mm. (b,e) ΔF/F images of activation. Color bars represent ΔF/F activation values in percentage. (c,f) ΔF/F traces for stimulation sites in the VPm and response site in S1 (c) or TRN (f). Light gray, stimulation site trace; black line, cortical (c) or thalamic reticular (f) response trace. Traces are averages of 10 × 10 pixels (555.8 μm2). Time, in seconds, is on the x axis and ΔF/F is on the y axis. Gray box corresponds to the time points that were excised because of a saturating flash artifact caused by the UV laser pulse. CS, corpus striatum, S1, primary somatosensory cortex, TRN, thalamic reticular nucleus and VPm, ventroposteriomedial thalamic nucleus.
