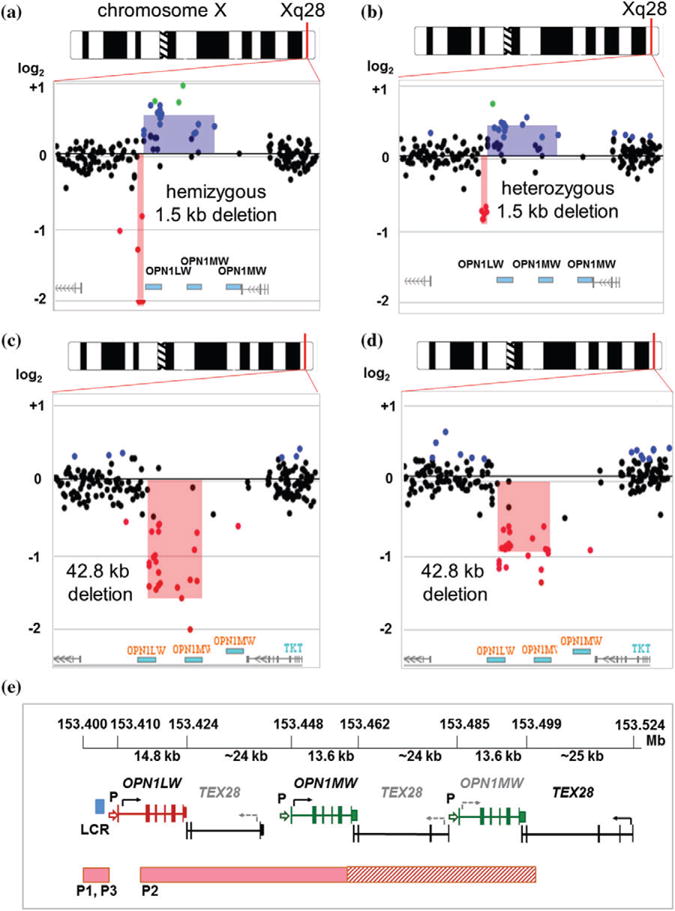
Fig. 2.

The Xq28 deletions detected by X-HR microarray. (a) An array-CGH plot showing copy number alterations in the Xq28 region in the male patient P1 (Family 1, IV-2) and (b) his mother (Family 1, III-4). Top, an idiogram of the X chromosome. The Xq28 region is indicated by a red line. Below, a magnified view of the Xq28 region showing a loss (pink shaded area) upstream of the OPN1LW gene and a gain (blue shaded area) in the total number of opsin genes. On the array-CGH plot, each dot represents an oligonucleotide DNA probe, arranged according to genomic location, from the proximal (left) to the distal long arm (right) of the X chromosome. The fluorescence intensity ratio Cy5/Cy3 (test/reference signal) for each probe is displayed as a logarithmic (log2) value on the Y-axis. Black dots represent probes with no change in DNA copy number (log2 above −0.5 and less than +0.2). Red dots indicate a loss in DNA copy number (log2 < −0.5). Gain in DNA copy number is detected for the segments with an average log2 > +0.2 (blue dots). In the proband P1 (a), an average log2 of < −2.0 indicates a hemizygous deletion (log2(0/1) = −∞) upstream of the OPN1LW gene. (c) X-HR microarray plot showing a loss (pink shaded area) of an at least 42.8 kb segment in the proband P2 (Family 2, III-6), and (d) his daughter (Family 2, IV-11). (e) A schematic representation of the human opsin gene cluster region. Top, genomic location (chrX:153.400–153.525 Mb; hg19) of the cluster, size, and distance between the opsin genes is shown. The single red opsin gene (14.8 kb in size) and the adjacent green opsin gene (13.6 kb) are expressed. Functional copies of the genes are indicated by bold font (black arrows indicate the direction of transcription). Inactive copies are marked by gray font (gray dashed arrows indicate the 5′ −3′ direction of an inactive gene). Each OPN1LW and OPN1MW consists of six exons, indicated by vertical bars, separated by the TEX28 genes. ‘P’ indicates a promoter sequence. Locus control region (LCR) is shown as a blue box. Deletions in the probands P1, P2, and P3 are shown by horizontal pink bars. In P2, the exact position of the distal breakpoint could not be precisely determined due to the repetitive structure of the DNA sequences in that region. Hatched bar indicates region of uncertainty for P2.
