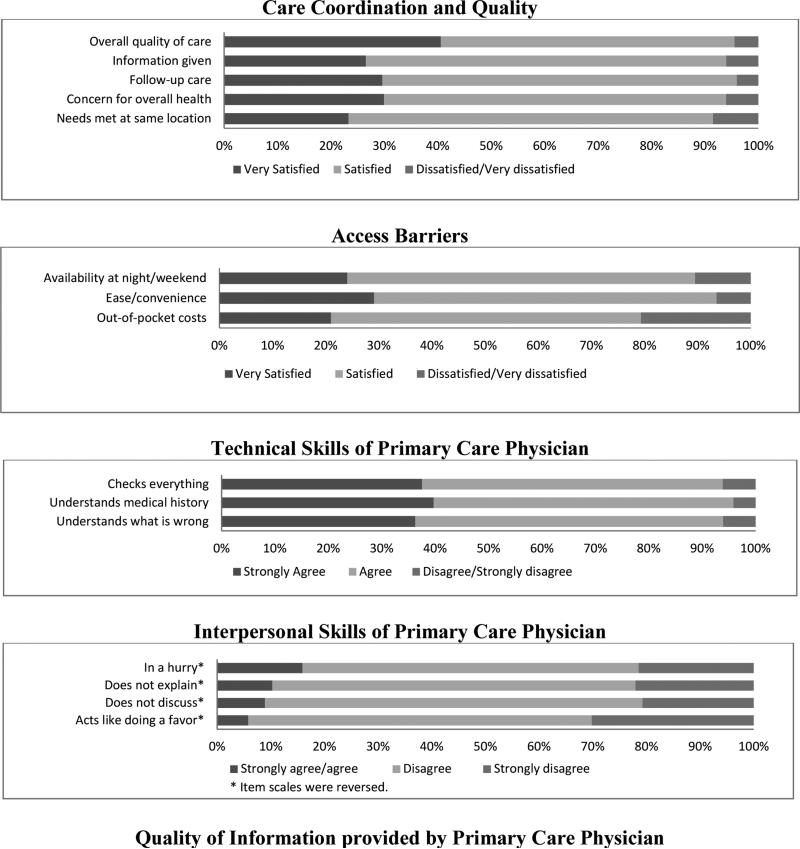
Figure 2.
Weighted Percentage Distribution of Responses Assessing Medical Care within the Medicare Current Beneficiary Survey from 2001 to 2011 according to Patient Satisfaction and Perceived Quality Dimensions.
Note: Some percentages of dissatisfied and very dissatisfied, disagree and strongly disagree, and strongly agree and agree were combined because of the small number. Excludes beneficiaries who reported “no experience.”


