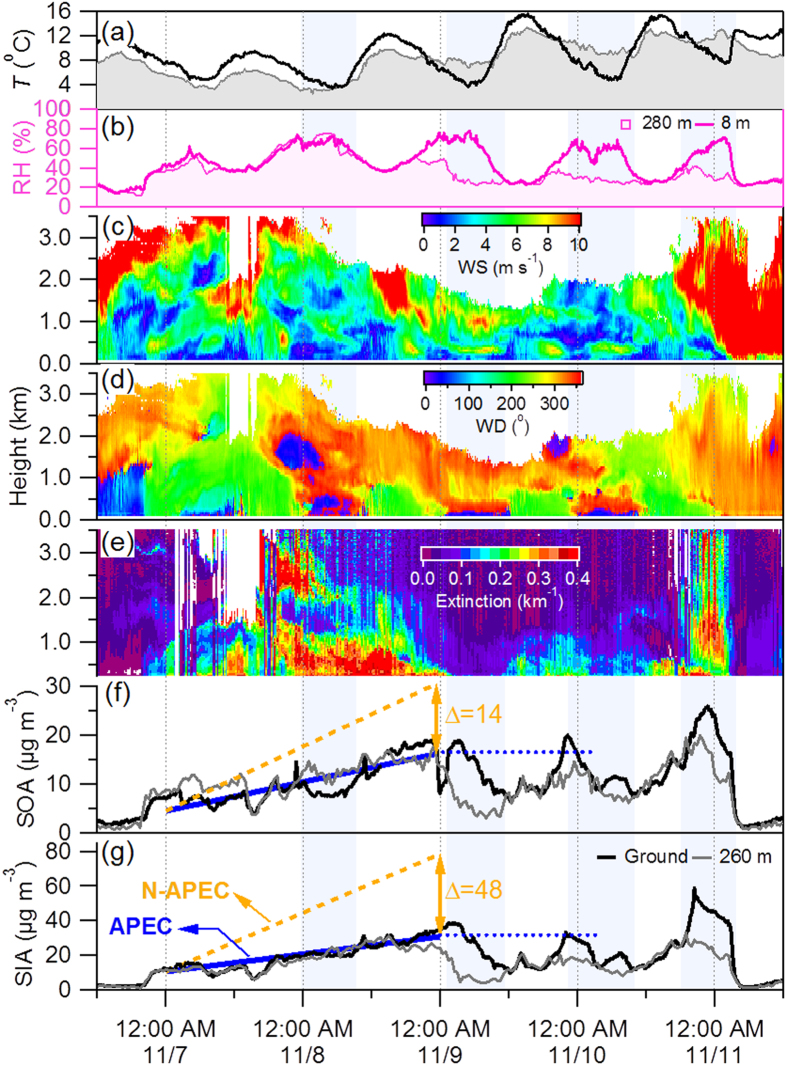
Figure 3. Evolution of meteorological parameters and secondary aerosol during APEC.
Time series of (a) temperature and (b) relative humidity at 260 m and at the ground site, vertical profiles of (c) wind speed, (d) wind direction, and (e) extinction coefficient, and (f,g) SOA and SIA at 260 m and the ground site. The solid blue lines represent the accumulation of SIA and SOA, respectively during APEC, and the two orange dash lines refer to the estimated accumulation of SIA and SOA without emission controls. The differences of SOA and SIA with and without emission controls after two days are 14 and 48 μg m−3, respectively. The dashed blue lines indicate a roughly stable variation of the maximum concentration of SOA and SIA.

