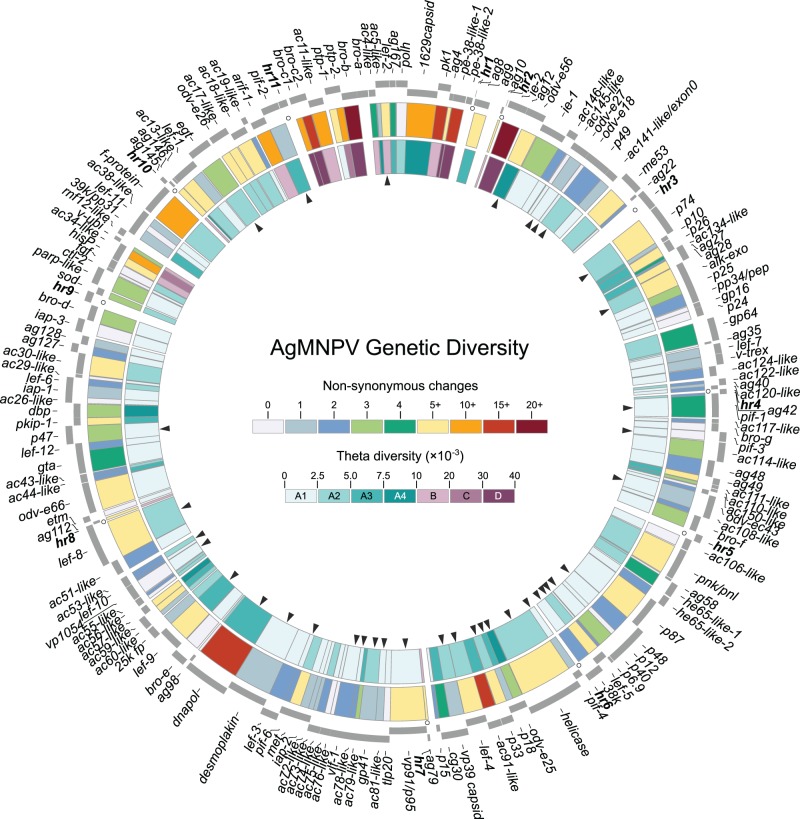
Fig. 6.—
Genetic diversity of the AgMNPV metapopulation. The external elements of this circular map represent ORFs in positive and negative sense, and the internal arrows highlight genes shared by all baculoviruses (core genes). The outer circle is a heat map of the number of nonsynonymous changes per gene. The inner circle shows genetic diversity measure based on the Watterson estimator (θ).

