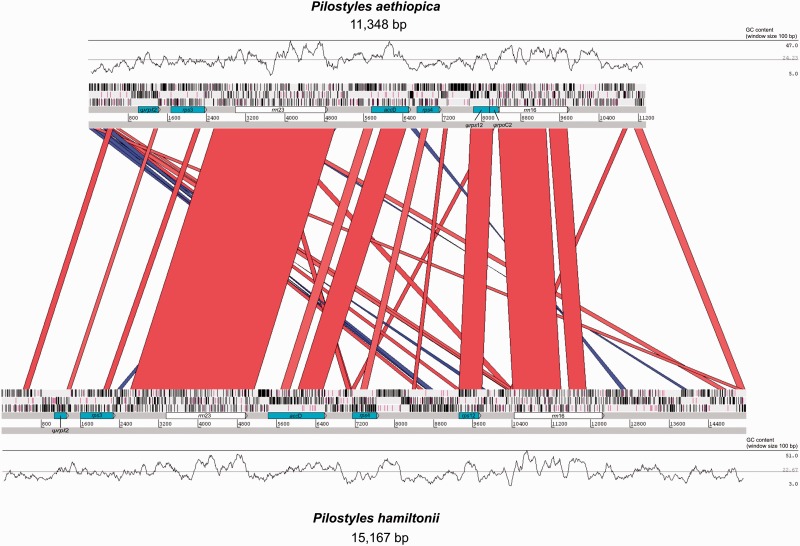
Fig. 3.—
Map of the plastid genomes of P. aethiopica and P. hamiltonii. The skyline graphs represent the GC% with the minimum, mean, and maximum values indicated on the right. The blue and red bands indicate identity greater than 70% for bitscores greater than 100, red bands show a match in the same orientation whereas blue bands symbolize reversed-complement matches. The three bars above the gene labels refer to the reading frames; stop codons are represented by vertical black bars, and start codons (methionine) by purple vertical bars. Ψ means the gene is pseudogenized. Visualization obtained with the Artemis Comparison Tool (Carver et al. 2005).

