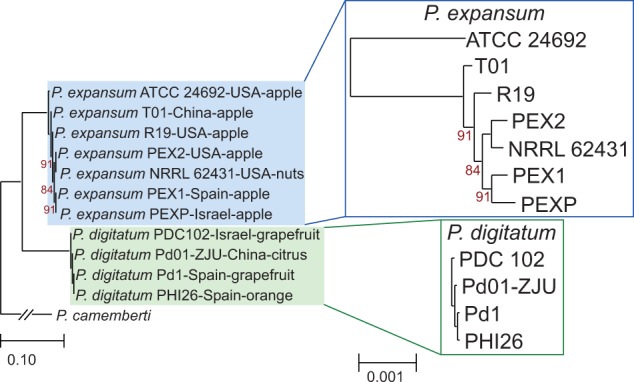
Fig. 2.—

Maximum likelihood species tree derived from the SNPs found in 5,892 protein-coding genes present in all species considered. All bootstrap values that are not maximal (100%) are indicated in the figure. Scales below indicate substitutions per site. Insets show detail of the subtrees containing P. expansum and P. digitatum lineages at a larger scale, to better appreciate the differences in branch lengths.
