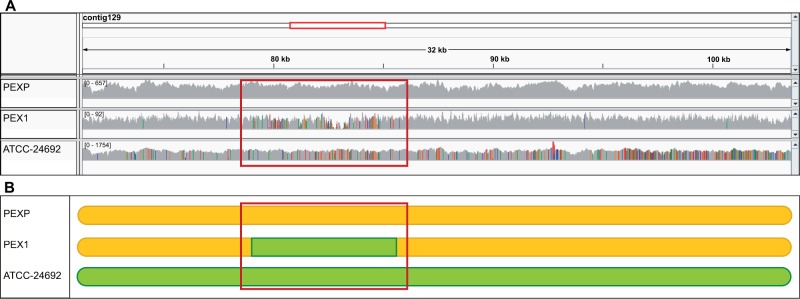
Fig. 3.—
(A) Visualization with the integrative genome viewer of the mapping results of a selected 32 kb region (coordinates with respect to the reference: contig 129:71,272–103,598). The region was predicted to contain a recombination track. The three lower frames show depth of coverage graphs for the mapping of the sequenced reads against the reference for PEXP, PEX1, and ATCC 24692 strains, in this order. SNPs are indicated with colors. Note that the reference strain, as expected, has no SNPs, and that PEX1 shows a region of possible recombination (highlighted with a red box) in which the SNP pattern is similar to that in ATCC 24692 whereas the surrounding regions have much fewer and distinct SNPs. (B) Schematic representation of the selected region, in which the two SNP patterns in (A) are indicated as different colors. The red square shows a region in which the strain PEX1 has a SNP pattern (green) which is different from the overall pattern of the rest of the region and that in PEXP (yellow), and similar to the one found in ATCC 24692.

