
Figure 4.
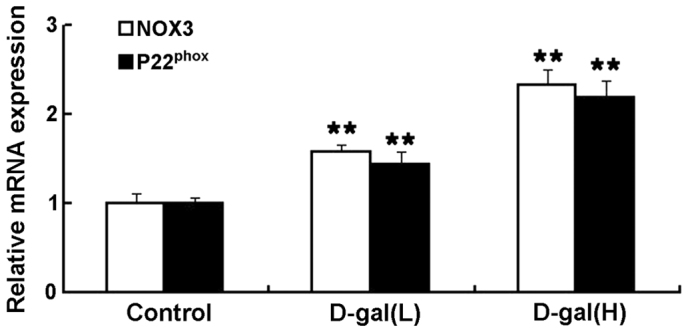
Quantitative analysis of the mRNA expression levels of NOX3 and P22phox in the cochleae of rats from the control and D-gal groups. The mRNA expression levels of NOX3 and P22phox were significantly increased in the D-gal groups, compared with the control group. The data are expressed as the mean ± standard deviation of six rats per group. **P<0.01, vs. control group. D-gal, D-galactose; H, 500 mg/kg; L, 150 mg/kg.