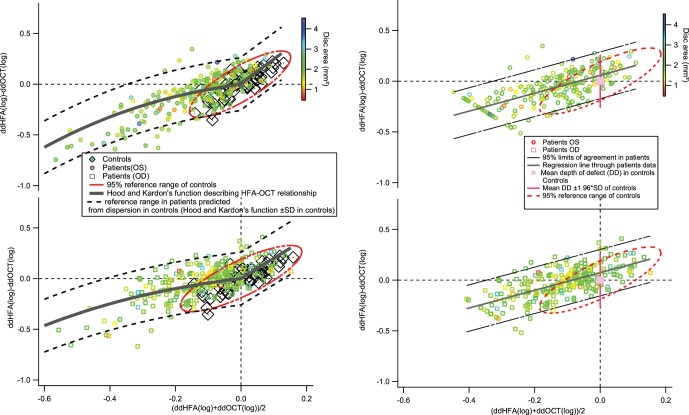
Figure 1.
Bland-Altman plots comparing perimetric sensitivity and RNFL thickness. The upper plots show data for left eyes and the lower plots show data for right eyes. The left panels show limits comparable to the Hood-Kardon model,14 and the right panels show the 95% limits of agreement comparable to the limits of Swanson et al.15 The color of the marker indicates the disc area (in mm2). The red ellipses on the left show the 95% prediction interval for the controls; the black broken lines show the 95% prediction interval for patients.

