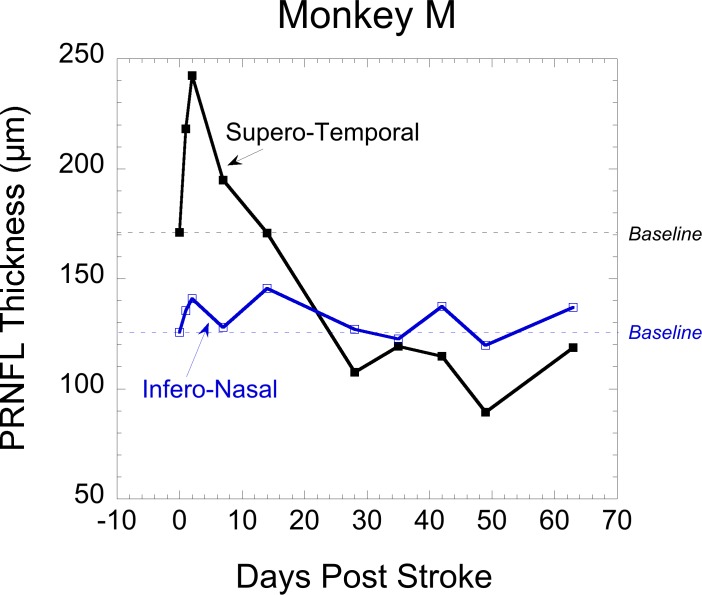
Figure 3.
Peripapillary retinal nerve fiber layer thickness as a function of time after induction in two peripapillary regions of monkey M. The horizontal dotted lines indicate the baseline thickness measurement for the specific sector. Values above each line indicate increased thickness and values below, decreased thickness (i.e., from atrophy). The graph shows that initial swelling in the superotemporal PRNFL was associated with later atrophy in the same region, whereas the PRNFL in the inferonasal region had very little swelling and subsequently had no significant thinning.

