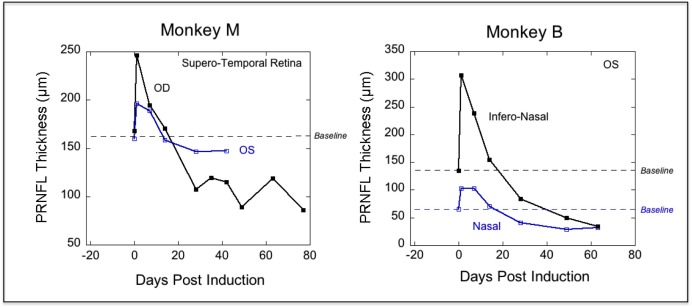
Figure 4.
Peripapillary retinal nerve fiber layer thickness measurements as a function of time after induction of pNAION in two monkeys. Select peripapillary regions from each monkey are shown to illustrate the correlation between the severity of swelling and the severity of subsequent atrophy. For monkey M, the superotemporal sectors of the right (black) and left (blue) eyes are shown, whereas the inferonasal (black) and nasal (blue) sectors of the same eye in monkey B are illustrated. Horizontal dashed lines indicate the baseline value of each sector. Values above the line indicate increases in thickness, whereas values below the line indicate decreases in thickness.

