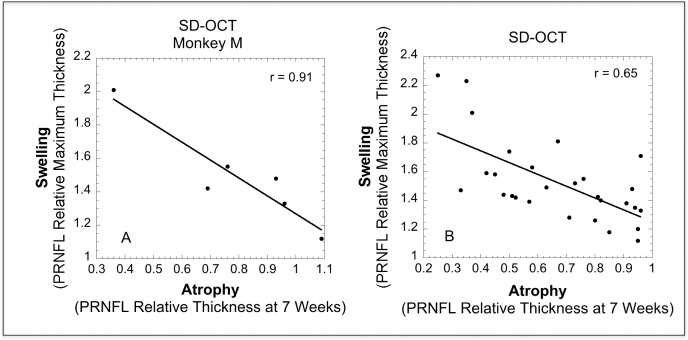
Figure 5.
Peripapillary retinal nerve fiber layer maximum thickness divided by baseline thickness, versus minimum thickness (atrophy) at 7 weeks post induction divided by baseline thickness. Data are plotted for all six peripapillary regions for monkey M (A) and for the five study monkeys (B). The linear equation fit to both sets of data indicates that for each initial 1% increase in thickness there is an eventual 0.82% to 1.07% loss in thickness.

