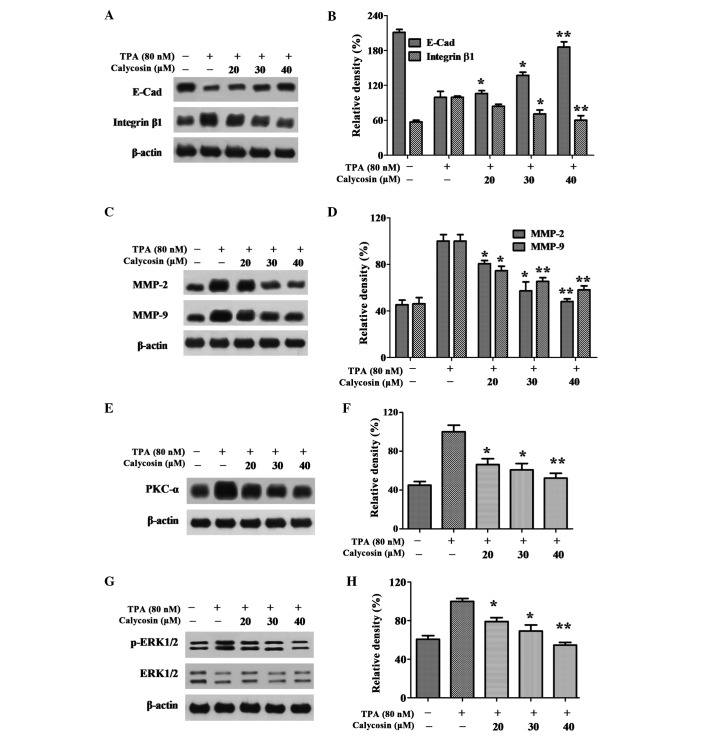
Figure 3.
Effect of Cal on the expression levels of PKC-α, p-ERK1/2, E-Cad, integrin β1, MMP-2 and MMP-9. (A) A549 cells were treated with various concentrations (0, 20, 30 and 40 µM) of Cal in the presence or absence of TPA (80 nM) for 24 h, and then subjected to western blotting to analyze the protein levels of E-cad and integrin β1. (B) Quantification of the protein level of E-cad and integrin β1. (C) A549 cells were treated with various concentrations (0, 20, 30 and 40 µM) of Cal in the presence or absence of TPA (80 nM) for 24 h, and then subjected to western blotting to analyze the protein levels of MMP-2 and MMP-9. (D) Quantification of the protein level of MMP-2 and MMP-9. (E) A549 cells were treated with various concentrations (0, 20, 30 and 40 µM) of Cal in the presence or absence of TPA (80 nM) for 24 h, and then subjected to western blotting to analyze the protein levels of PKC-α. (F) Quantification of the protein level of PKC-α. (G) A549 cells were treated with various concentrations (0, 20, 30 and 40 µM) of Cal in the presence or absence of TPA (80 nM) for 24 h, and then subjected to western blotting to analyze the protein levels of p-ERK1/2 and ERK1/2 (H) Quantification of the proteins level of p-ERK1/2 and ERK1/2. Values are presented as the mean ± standard deviation of three independent experiments, performed in triplicate. *P≤0.05 and **P≤0.01, vs. TPA-induced group. Cal, calycosin; TPA, phorbol-12-myristate-13-acetate; PCK, protein kinase C; p-ERK, phosphorylated extracellular signal-regulated kinase; E-Cad, E-cadherin; MMP, matrix metalloproteinase.

