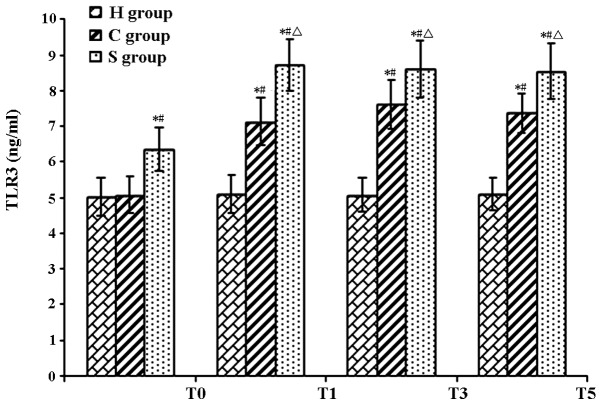
Figure 4.
TLR3 protein levels in rat hippocampi in the experimental groups at various time-points. Values are expressed as the mean ± standard deviation. #P<0.05 compared with T0; *P<0.05 compared to H group; ΔP<0.05 compared with C group. H, sham group; C, CPB group; S, sevoflurane-pre-conditioned group; T0, prior to CPB; T1, CPB for 30 min; T2, CPB for 1 h; T3, 1 h after 1-h CPB; T4, 2 h after 1-h CPB; T5, 3 h after 1-h CPB; CPB, cardiopulmonary bypass; TLR, Toll-like receptor.

