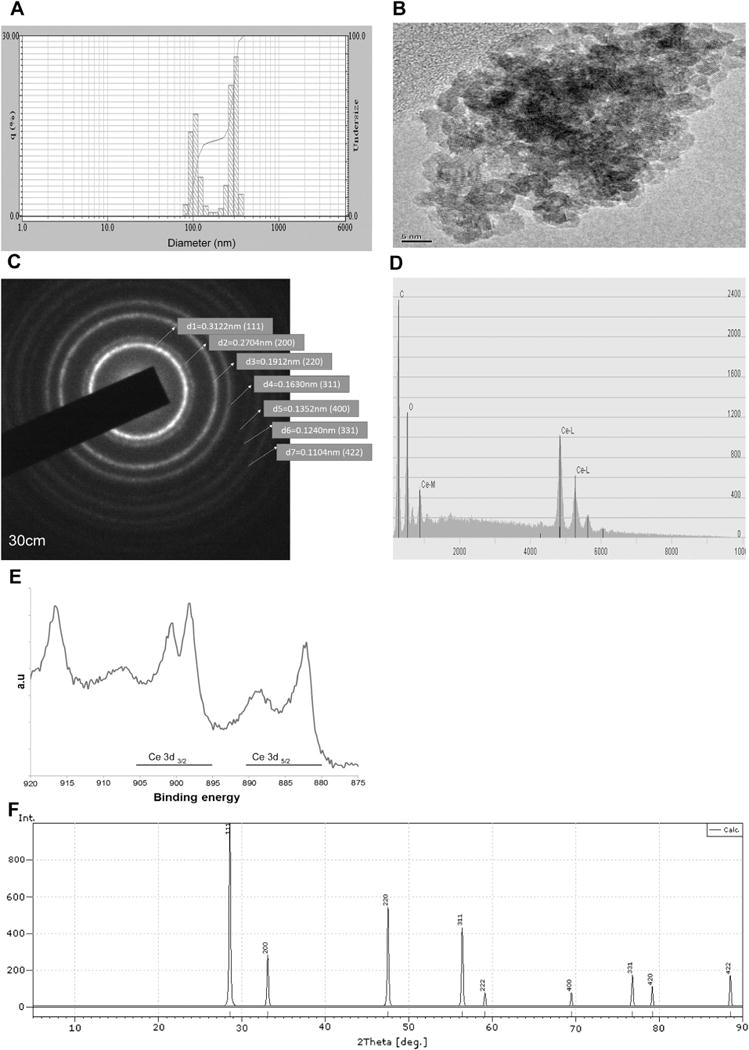
Fig. 1. Characterization of CeO2 nanoparticles.

Nanoparticle size was determined by dynamic light scattering (DLS) (Panel A) and transmission electron microscopy (TEM) (Panel B). Corresponding scattered area diffraction is shown (Panel C). Energy dispersive X-ray spectroscopy shows the presence of cerium and oxygen in the nanoparticles (Panel D). X-ray photoelectron spectroscopy shows the relative amounts of Ce+3 and Ce+4 in the nanoparticles (Panel E). X-ray diffraction of the nanoparticles demonstrates the typical lattice structure (Panel F).
