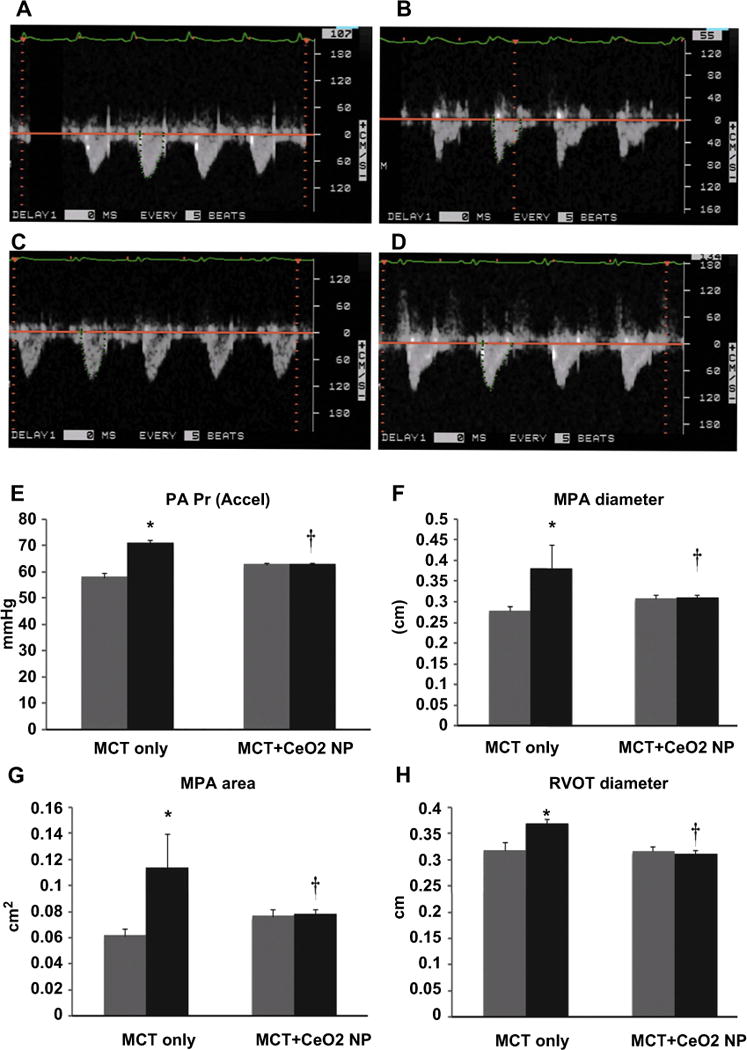
Fig. 2. CeO2 nanoparticle treatment improves pulmonary flow and diminishes pulmonary artery remodeling.

Pulsed-wave Doppler echocardiography demonstrating normal, round shaped flow profile at baseline (day 1) in the MCT rats (Panel A) and triangular flow profile with mid-systolic notching on day 28 (Panel B). Normal, round shaped flow profile at baseline (day 1) in the MCT + CeO2 nanoparticle treated rats (Panel C) and the continuation of the normal, round shaped flow profile observed with CeO2 nanoparticle treatment at day 28 of treatment (Panel D). Pulsed-wave Doppler echocardiography quantified data for pulmonary arterial pressure (Panel E), mean pulmonary arterial diameter (Panel F), mean pulmonary arterial area (Panel G), right ventricular outflow tract diameter (Panel H). Data are mean ± SEM (n = 6 rats/group). Grey columns indicate readings at day 1 while black columns denote readings at day 28. *Significantly different from base line values of MCT only group. † Significantly different from day 28 values of MCT only group (P < 0.05). (For interpretation of the references to colour in this figure legend, the reader is referred to the web version of this article.)
