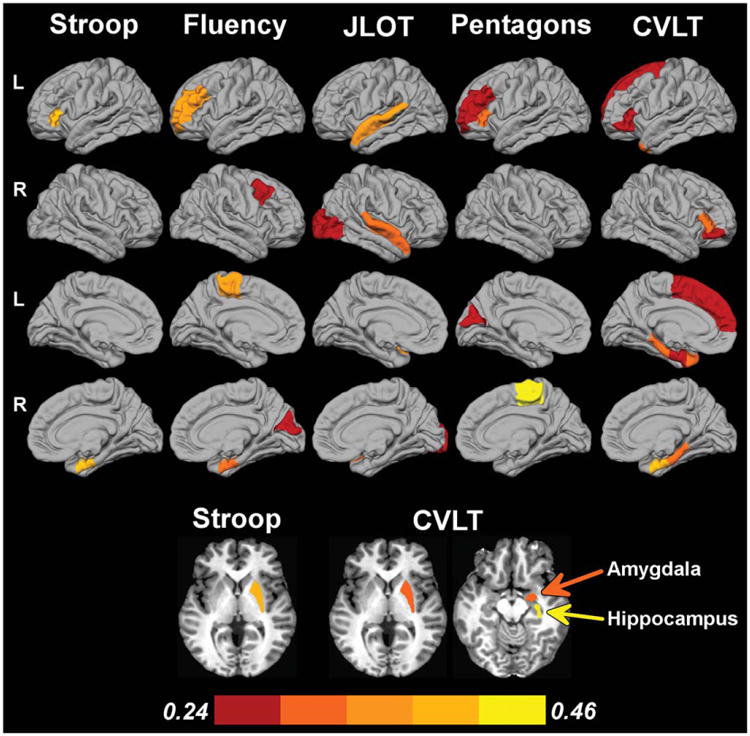
Fig. 1.

Correlation of regional volumes with cognitive performances in PD. Cortical regions are displayed on lateral and medial surfaces of the left (L)/right (R) hemispheres. Axial views show putamen, amygdala, and hippocampus. Color bar designates the partial correlation coefficient magnitude.
