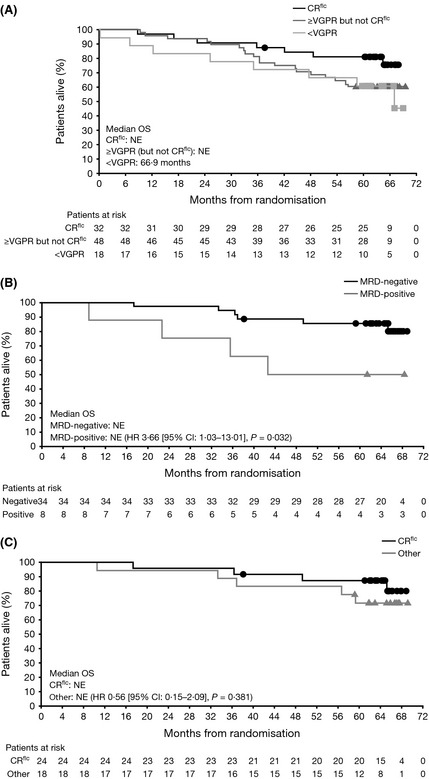
Figure 3.

Overall survival (OS) according to minimal residual disease (MRD) status and response (pooled across VTD and VTDC arms). Kaplan–Meier analyses of OS in: (A) patients who achieved CR flc, ≥VGPR but excluding the CR flc patients, or <VGPR; (B) patients with bone marrow‐confirmed CR who were MRD‐negative or MRD‐positive; (C) MRD‐negative patients who achieved CR flc or other responses. CI: confidence interval; CR: complete response; CR flc: CR with normalized serum free light chain ratio; HR: hazard ratio; NE: not estimatable; VGPR: very good partial response; VTD, bortezomib‐thalidomide‐dexamethasone; VTDC, bortezomib‐thalidomide‐dexamethasone plus cyclophosphamide.
