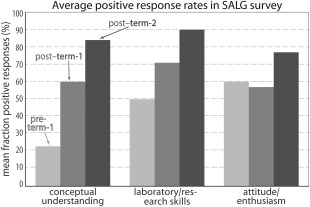
Figure 6.

SALG surveys reveal positive response rates for three criteria: understanding of biochemical concepts (left), laboratory/research skills (middle), and attitude/enthusiasm for biochemical research (right). In each triad, representative data are shown for pre–term‐1 (light grey), post–term‐1 (medium gray), and post–term‐2 (dark gray); in a year‐long course, these terms correspond to the start of Fall semester, end of Fall, and end of Spring, respectively. Numerical values and further details are discussed in the text.
