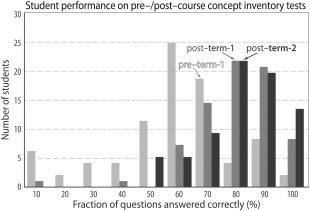
Figure 8.

Pre– and post–course concept inventory tests were used to assess student learning and retention of scientific content. This histogram plots data for pre–term‐1 (light grey), post–term‐1 (medium gray), and post–term‐2 (dark gray); numerical values and further details are presented in the text.
